
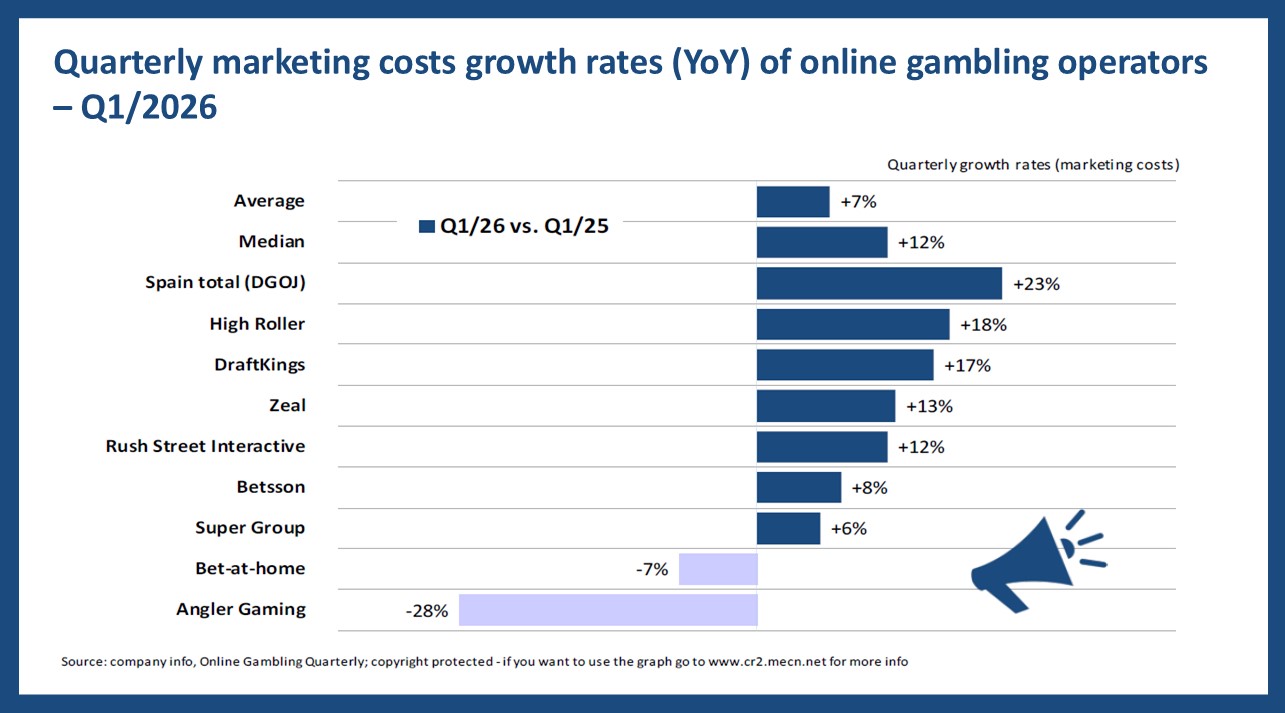
In these analyses, the OGQ takes an in-depth look at the Quarterly marketing costs growth rates (YoY) of online gambling operators – Q1 2026. The data research compares how marketing spending changed across selected gambling operators and market-level benchmarks.
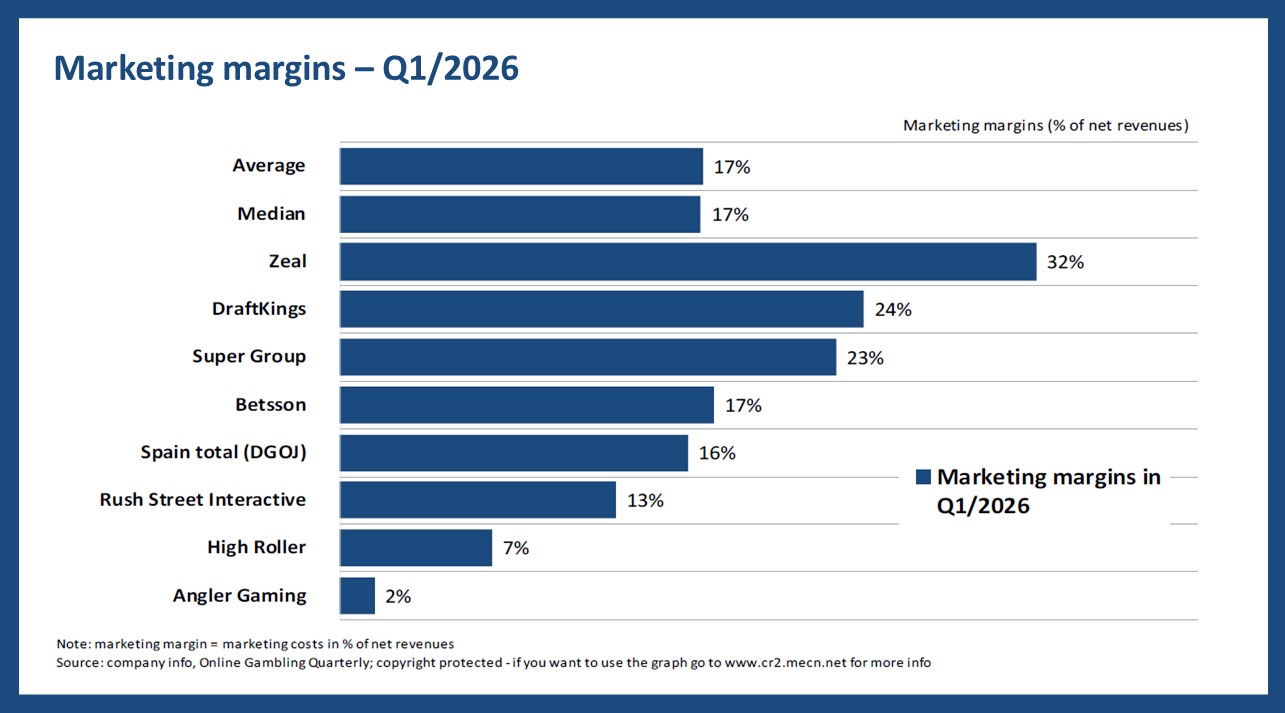
Marketing margins – Q1/2026
The first visible chart shows how much of net revenue operators spent on marketing in Q1/2026.
- Zeal had the highest marketing margin at 32%. DraftKings followed with 24%, while Super Group also remained elevated at 23%.
- The average marketing margin was 17%, matching the median. That suggests the market was fairly balanced.
- Angler Gaming posted the lowest margin at just 2%. High Roller also stayed low, with marketing costs at 7% of net revenues.
Quarterly marketing costs growth rates (YoY) of online gambling operators – Q1/2026
The second visible chart shows a mixed picture for year-on-year marketing cost growth in Q1/2026.
- Spain total recorded the strongest YoY growth at +23%. High Roller and DraftKings also posted clear double-digit increases.
- Average growth reached +7%, while the median was higher at +12%. That points to several operators still expanding marketing budgets.
- Angler Gaming had the steepest decline at -28%.
Please find more data and the methodology applied in the current edition of the OGQ Magazine. Also, find more content in our data section.
 powered by