In these analyses, the OGQ takes an in-depth look at the Marketing cost benchmarks Q3 2024. The data highlights trends in marketing expenditures, growth rates, and marketing margins across different operators. Year-over-year and quarter-over-quarter comparisons reveal significant variances, showcasing key performers and underperformers in the sector.
Quarterly Marketing Costs Growth Rates (YoY) of Online Gambling Operators – Q3 2024
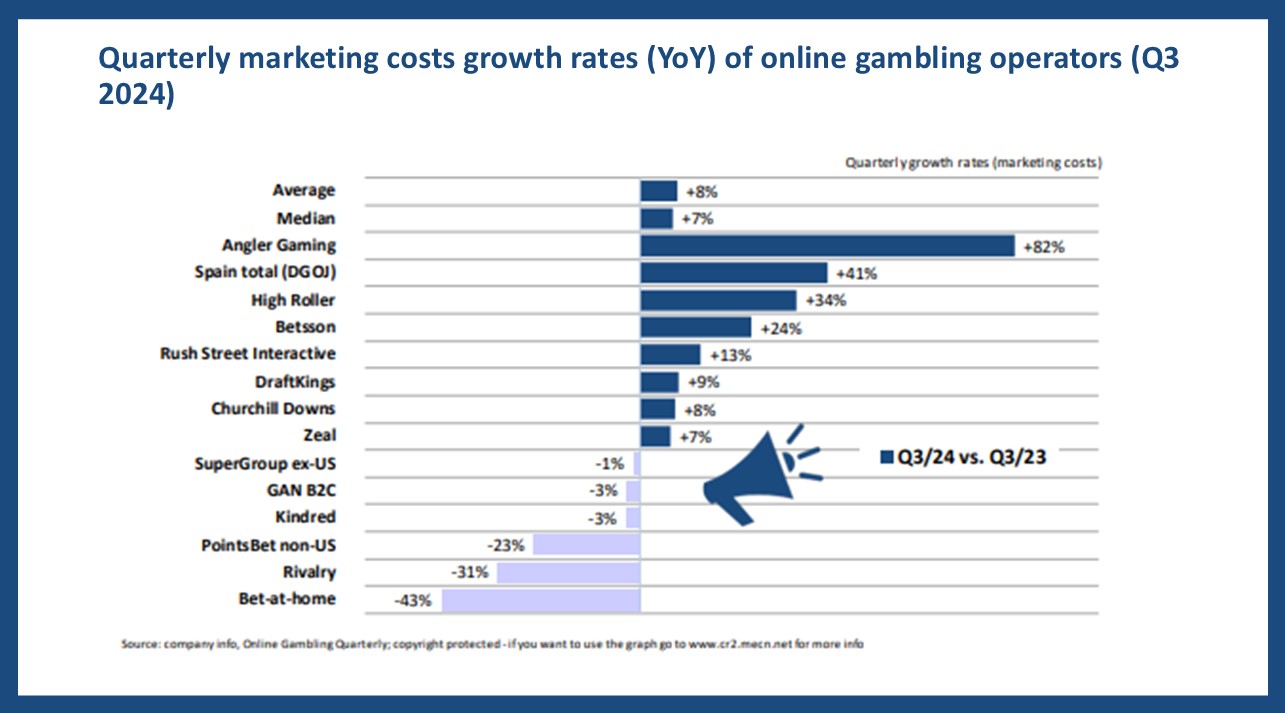
Marketing costs in Q3 2024 saw an average year-over-year (YoY) growth of 8%, while the median growth stood at 7%.
- Angler Gaming recorded the highest YoY growth rate of +82%, showing substantial marketing investment compared to Q3 2023.
- Spain total (DGOJ) and High Roller followed with YoY growth rates of +41% and +34%, respectively.
- The industry average marketing cost growth was 8%, with operators generally seeing single-digit increases.
- Bet-at-home experienced the most significant decline with a YoY decrease of -43%, marking a sharp contrast to the highest-growing operators.
- Other notable declines included Rivalry (-31%) and PointsBet non-US (-23%), reflecting strategic cost reductions.
Quarterly Marketing Costs Growth Rates (QoQ) – Q3 2024 vs. Q2 2024
Compared to Q2 2024, marketing costs decreased by an average of -9%, while the median decline was -6%.
- DraftKings had the highest QoQ growth, increasing marketing costs by 58%, signaling a strong push in Q3 2024.
- The industry average QoQ change was negative, with most companies reducing their marketing expenses.
- Churchill Downs saw the most significant decline, with a drop of -71%, highlighting cost-cutting measures.
Marketing Margins in Q3 2024
Marketing margin, defined as marketing costs as a percentage of net revenues, averaged 26% across operators in Q3 2024.
- Rivalry had the highest marketing margin at 72%, indicating a heavy investment in customer acquisition.
- High Roller and Spain total (DGOJ) followed with 38% each, ranking among the top spenders.
- The industry median marketing margin was 24%, aligning closely with the overall average of 26%.
- Operators with marketing margins below 20% included Betsson (16%) and Churchill Downs (1%),.
- Zeal, DraftKings, and PointsBet non-US fell within the mid-range, maintaining margins between 24% and 31%.
More info about this analysis: Marketing cost benchmarks – Q3 2024. Please find more data and the methodology applied in the current edition of the OGQ Magazine – http://www.quarterly.og-q.com. Also, find more content in our data section https://www.ogqnews.com/category/data/.
