
In these analyses, the OGQ takes an in-depth look at the P/E ratios of online gambling companies at the end of Q2 2026. The data research follows listed online gambling companies through market capitalisation, earnings multiples and revenue-related valuation ratios.
Market capitalisation of key companies in the online gambling industry | Q2 2026
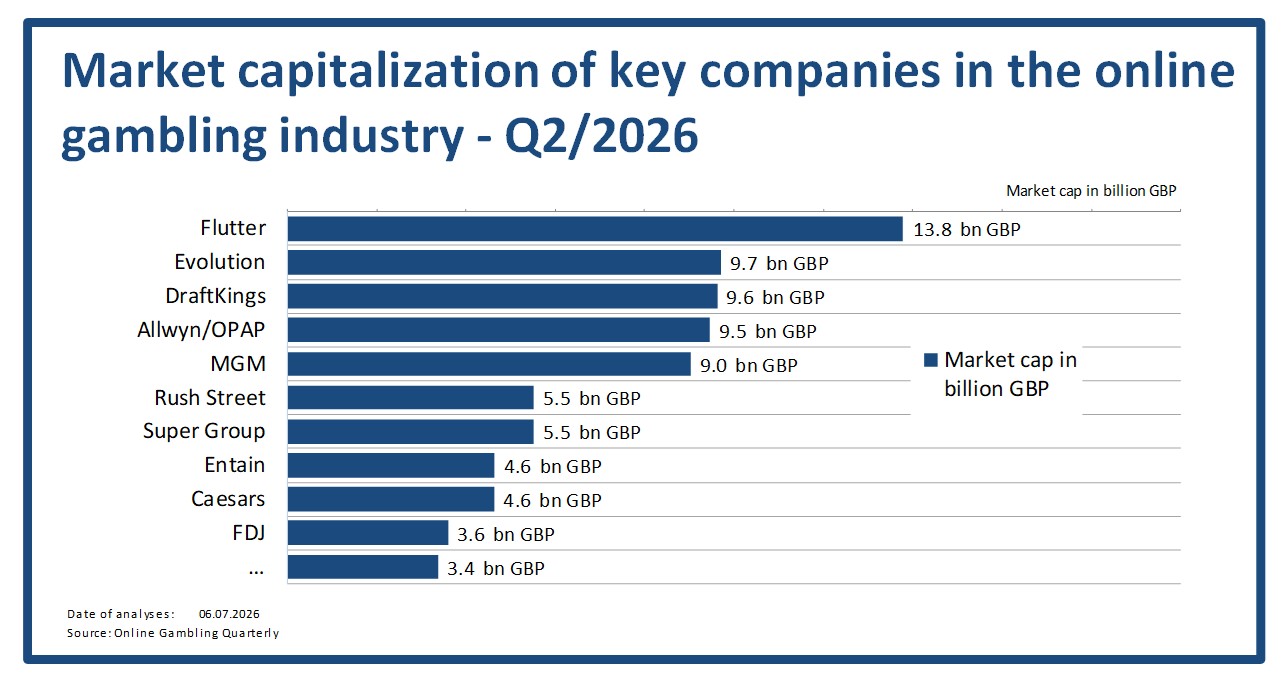
The first visible chart shows a wide gap between the largest listed online gambling groups and the rest of the market.
- Flutter sits clearly at the top with a market capitalisation of GBP 13.8 billion. Evolution and DraftKings follow closely behind.
- Average market capitalisation across the analysed companies is GBP 2.8 billion.
- Smaller listed groups sit far below the leaders. The PE ratios of online gambling companies at the end of Q2 2026 also highlights this uneven market structure.
P/E ratios and market cap / revenue ratio
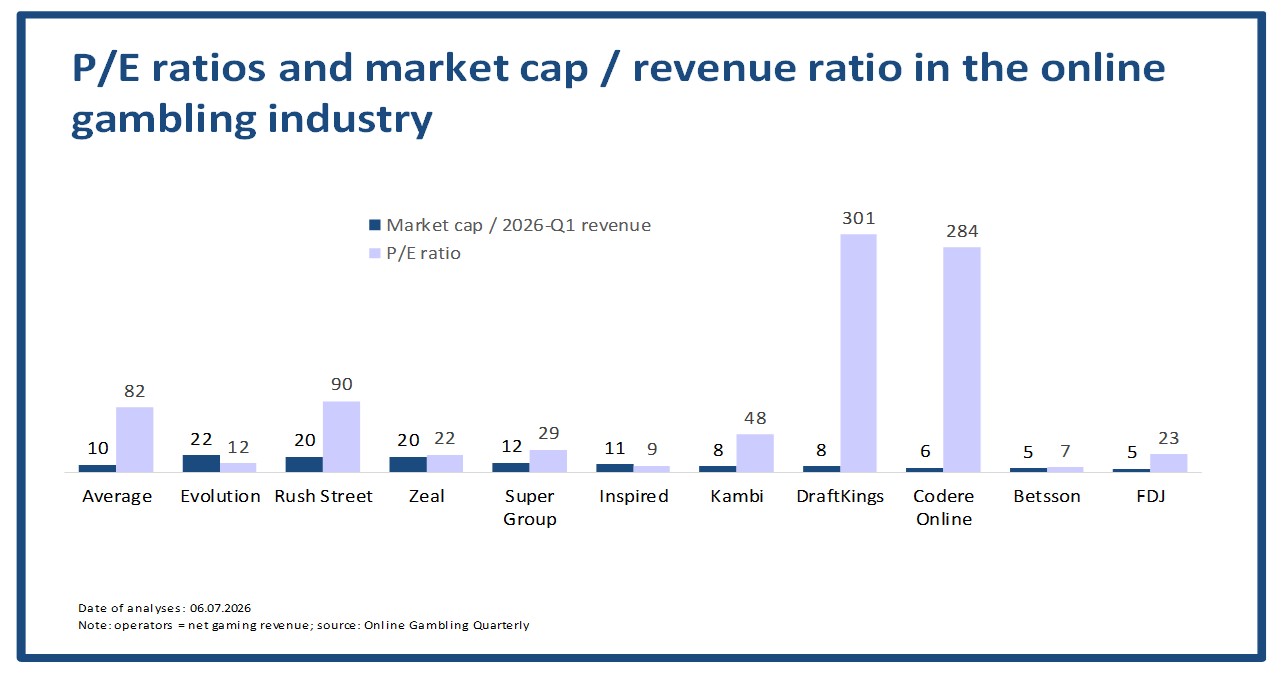
The second visible chart compares earnings-based valuation with market capitalisation relative to Q1 2026 revenue.
- DraftKings has the highest P/E ratio at 301.
- Average P/E ratio in the sample is 82, while the median is 26. That gap points to a few very highly valued outliers.
- Evolution leads the market cap to revenue ranking with a ratio of 22. Rush Street and Zeal follow closely, each at 20.
Please find more data and the methodology applied in the current edition of the OGQ Magazine. Also, find more content in our data section.
 powered by