
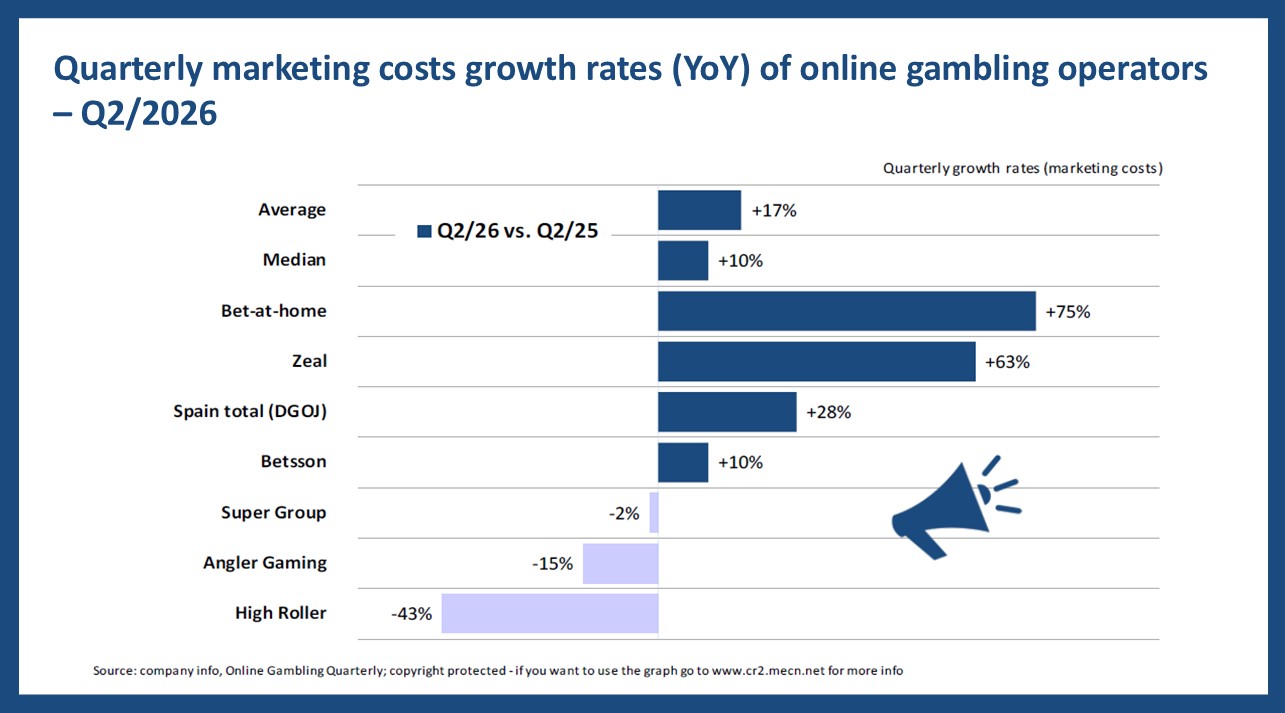
In these analyses, the OGQ takes an in-depth look at the Quarterly marketing costs growth rates (YoY) of online gambling operators – Q2 2026. The analysis compares changes in marketing expenditure across leading online gambling operators, highlighting differences in spending patterns and growth rates.
Quarterly marketing costs growth rates (YoY) of online gambling operators – Q2/2026
Marketing costs among online gambling operators increased overall in Q2/2026, although spending trends varied considerably between companies. Bet-at-home and Zeal recorded the strongest annual increases, while several operators reduced their marketing expenditure compared with the previous year.
- Average and median growth: Marketing costs increased by an average of 17% year-on-year, while median growth reached 10%. This highlights differences in spending across operators.
- Top performers: Bet-at-home recorded the highest annual increase at 75%, followed by Zeal at 63%. Spain’s overall market recorded 28% growth.
- Declining marketing costs: High Roller recorded the largest decrease at 43%. Angler Gaming reduced spending by 15%, while Super Group reported a 2% decline.
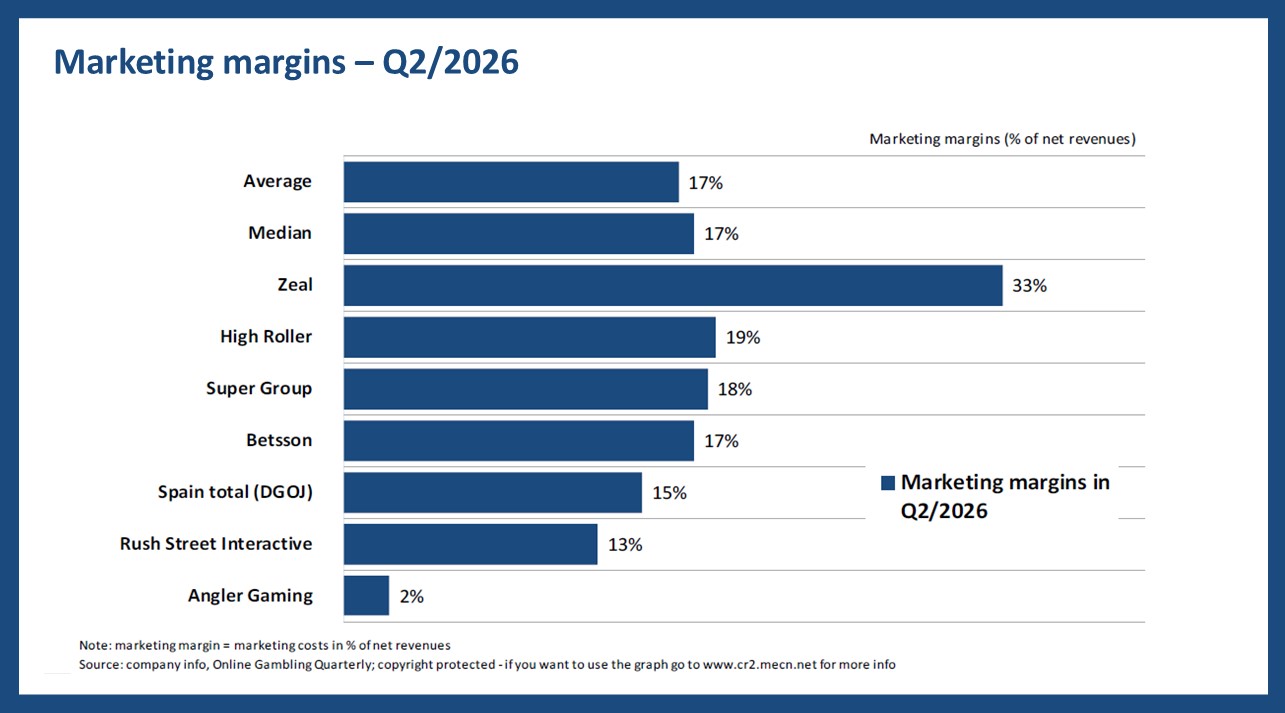
Marketing margins – Q2/2026
Marketing margins show how much online gambling operators spent on marketing as a percentage of their net revenues in Q2/2026. Zeal recorded the highest margin among the analysed operators, while spending levels varied significantly across the remaining companies.
- Average marketing margin: The average margin stood at 17%, matching the median of 17%. This provides a benchmark for marketing expenditure relative to net revenues.
- Highest marketing margins: Zeal led with a margin of 33%, followed by High Roller at 19%. Super Group ranked next at 18%.
- Lower marketing margins: Angler Gaming recorded the lowest margin at 2%, while Rush Street Interactive reached 13%. Spain’s overall market stood at 15%.
Please find more data and the methodology applied in the current edition of the OGQ Magazine. Also, find more content in our data section.
 powered by