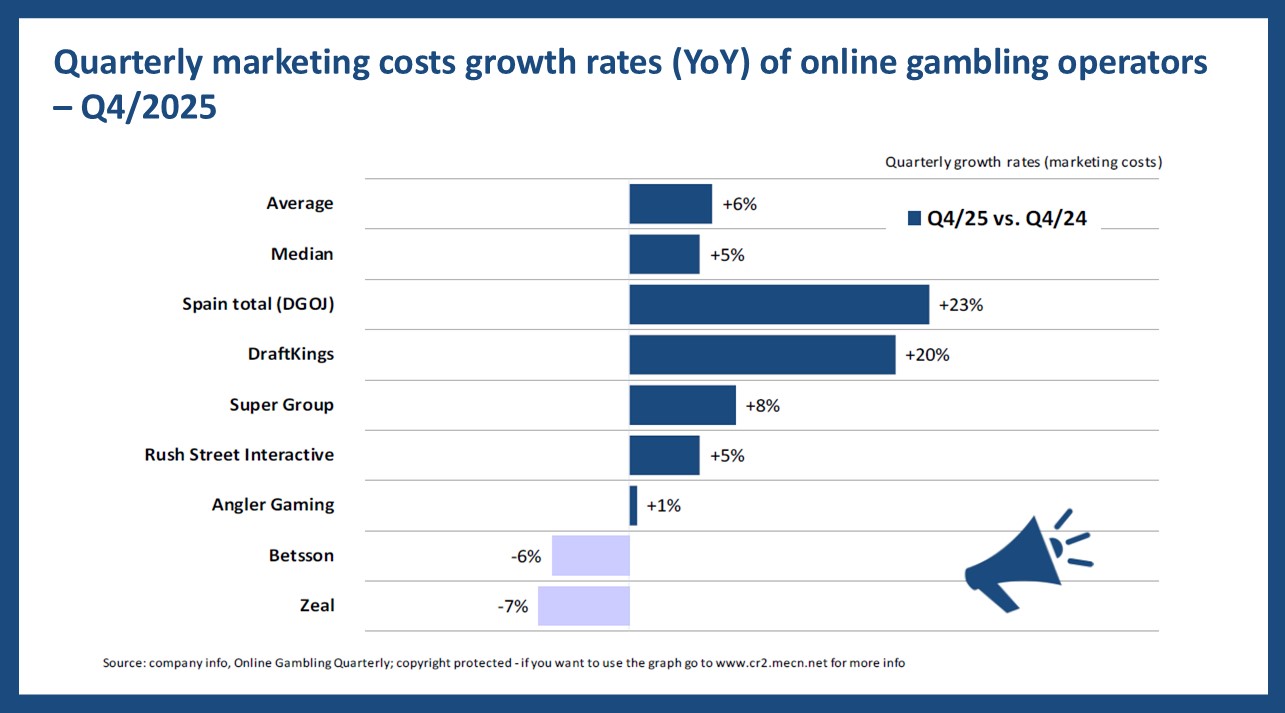
In these analyses, the OGQ takes an in depth look at the following topic: Quarterly marketing costs growth rates (YoY) of online gambling operators – Q4 2025. The data research compares how marketing spending changed year on year and how heavily operators leaned on marketing relative to revenue.
Quarterly marketing costs growth rates (YoY) of online gambling operators – Q4/2025
This chart compares year-on-year changes in marketing costs across the selected operators.
- The average growth came in at +6%, while the median stood at +5%. That points to a generally positive direction for marketing spend across the market.
- The strongest growth was recorded by “Spain total”, with DraftKings also standing out.
- The wider spread in results suggests a mixed spending pattern across operators.
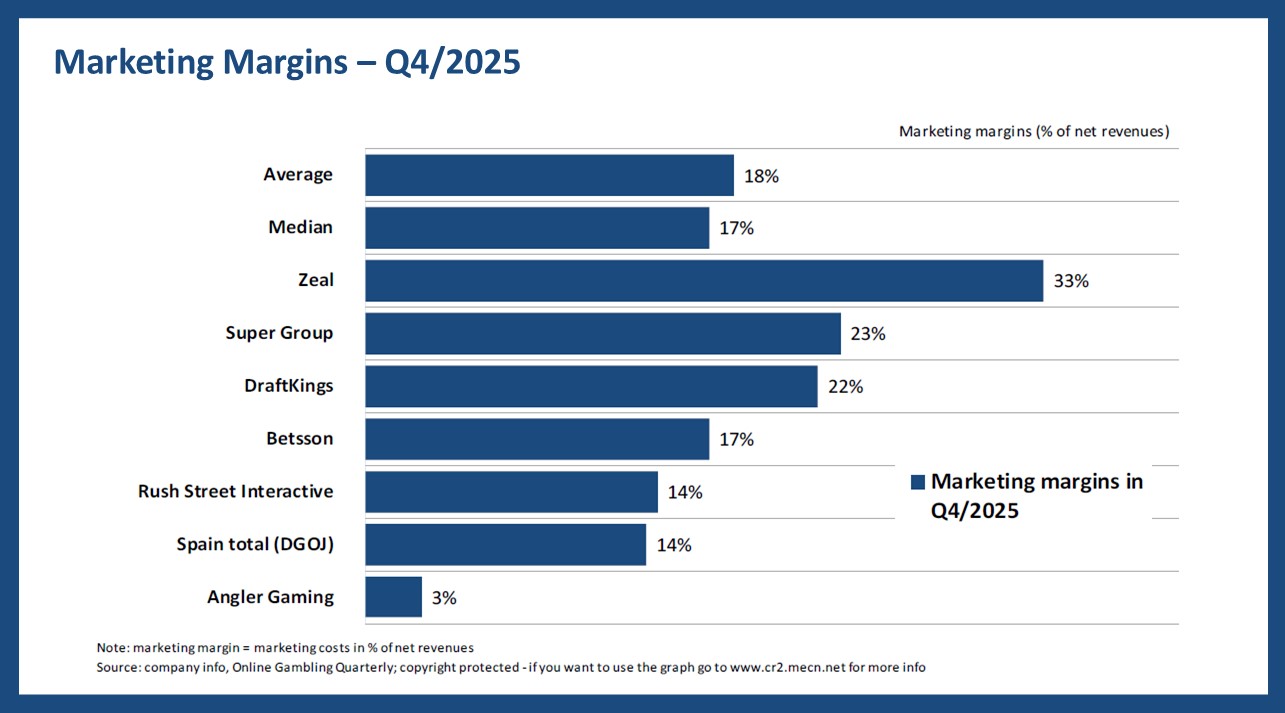
Marketing margins – Q4/2025
This chart looks at marketing costs as a share of net revenue across the analysed operators. It shows a broad range of spending intensity, with a few operators setting a much more aggressive pace than the rest.
- The average margin was 18%, and the median came in at 17%.
- The highest margins were posted by Zeal, Super Group and DraftKings. Their positions suggest a stronger willingness to devote revenue to customer acquisition and brand activity.
- Across the ranking, marketing intensity varied widely from one company to another.
Please find more data and the methodology applied in the current edition of the OGQ Magazine. Also, find more content in our data section.